Catching Up
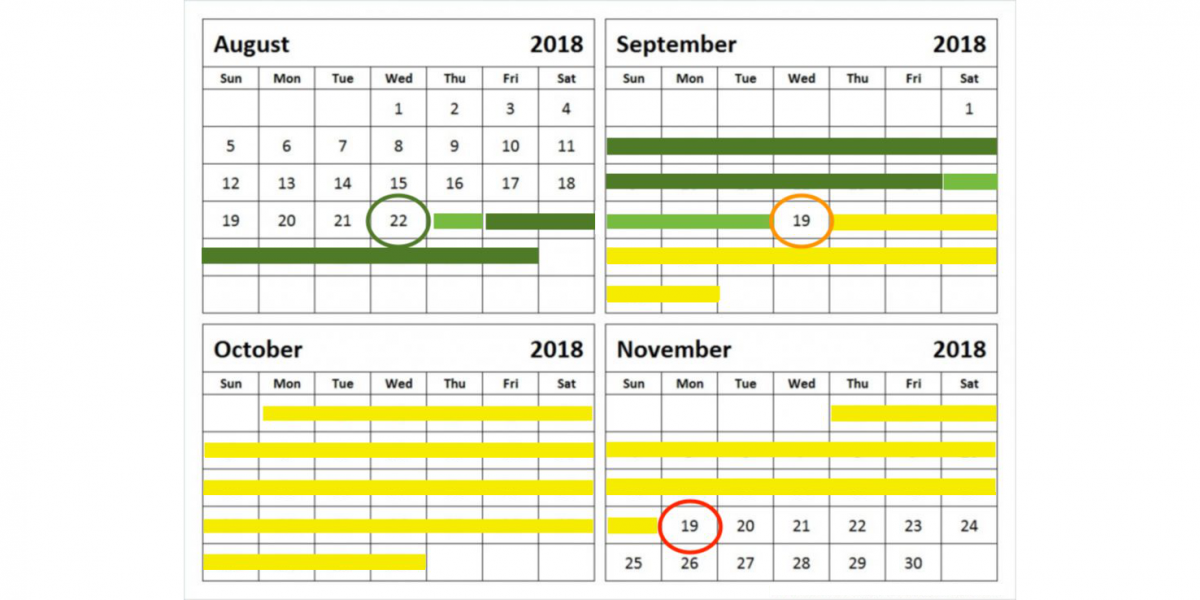
I have not been good at keeping up with blogging. After returning home from the fasting retreat, life got in the way! I took my labs on November 19th (approximately 2 months after returning from the fasting clinic) and had intended on blogging right away. However, moving into our new condo, my current consulting gigs, and the kids coming home from college over the holidays just kept me too busy. Here on Christmas morning, I am publishing a backlog of 3 posts while the kids are sleeping!
Glucose and HbA1C
The bad news here is that my fasting blood glucose during the test was 157! This number didn’t surprise me that much because it’s a number that I was measuring with my blood glucose meter. My blood sugar was running higher at the time of the test, as the instructions I received when making the appointment called for keeping a “stable diet and weight” for two weeks prior to the blood test. So, for two weeks, I chose to avoid the 36-hour fasts which does help control my blood sugar but also makes my weight fluctuate a lot between feeding and fasting. I won’t follow the instructions that way the next time!
That said, even with the two weeks of without fasting, the good news from my November labs is that my HbA1C (3 month average of blood glucose levels) went down — even after returning home from the fasting clinic! When I left, my number was 7.0, and it went down to 6.7 two months later! It’s still not where it needs to be (below 6.5), but it’s close and improving!
Change in LDL Particle Size?
While at the fasting clinic, I also was a participant in a study about the effect of prolonged fasting on LDL particle size. (For more information about LDL particle size, see my previous article). Alternate day fasting has already been shown to increase LDL particle size, and the prevailing theory is that prolonged fasting produces a similar effect. The significant reduction in my Triglyceride / HDL ratio from 4.1 before the clinic, to 2.2 immediately after the clinic, and down to 1.7 two months later does seem to support that hypothesis!
The Numbers
| Normal | 23-Aug | 17-Sep | 19-Nov | Comments | |
| Glucose in serum | 60-100 | 133 | 106 | 157 | High for 2 weeks… |
| HbA1C | < 5.7 | 7.5 | 7.0 | 6.7 | Better! |
| Cholesterol Total | < 200 | 296 | 262 | 288 | See note |
| HDL Cholesterol | > 40 | 52 | 62 | 83 | Good! |
| LDL / HDL Ratio | < 3.0 | 3.8 | 2.9 | 2.1 | Normal! |
| LDL Cholesterol | < 155 | 296 | 181 | 177 | See note |
| Triglyceride | < 150 | 215 | 136 | 138 | Normal! |
| TG / HDL Ratio | < 2 | 4.1 | 2.2 | 1.7 | Normal! |
Note: LDL and Total Cholesterol readings have been shown to be flawed predictors of heart disease. TG / HDL ratio was computed and added to this chart as an alternative predictor.
Interesting article about HDL in the NYT.
https://www.nytimes.com/2018/12/24/well/eat/hdl-cholesterol-too-much-of-a-good-thing.html?action=click&module=Discovery&pgtype=Homepage
Ray – this will be interesting to watch! Just published a blog post about this! https://time-restricted.com/2018/12/27/is-too-much-good-cholesterol-bad-for-you/
Hi there Steve! Remember me? I’d love to chat with you sometime about the research you’ve been doing on cholesterol numbers, fasting, diet, etc. I too have some pretty high cholesterol numbers and have struggled with how to reconcile them, what they might mean, and what to do about them. I’ve used time-restricted eating to easily and significantly reduce my weight, but am not sure what/if any impact it’s been having on my cholesterol values. I’ll leave me email and maybe we can share thoughts or arrange to get together and chat? Thanks! Linda