• Skip to main content
  • Skip to primary sidebar
  • Skip to footer
  • All Posts
  • Contact

Time Restricted

Experiences with Time-Restricted Eating and Managing Chronic Disease

Archives for December 2018

Association between HDL and all-cause mortality

December 27, 2018 By spao Leave a Comment

Is too much “good cholesterol” bad for you?

A good friend just pointed me to an interesting article from the New York Times that came out Christmas Eve Day.

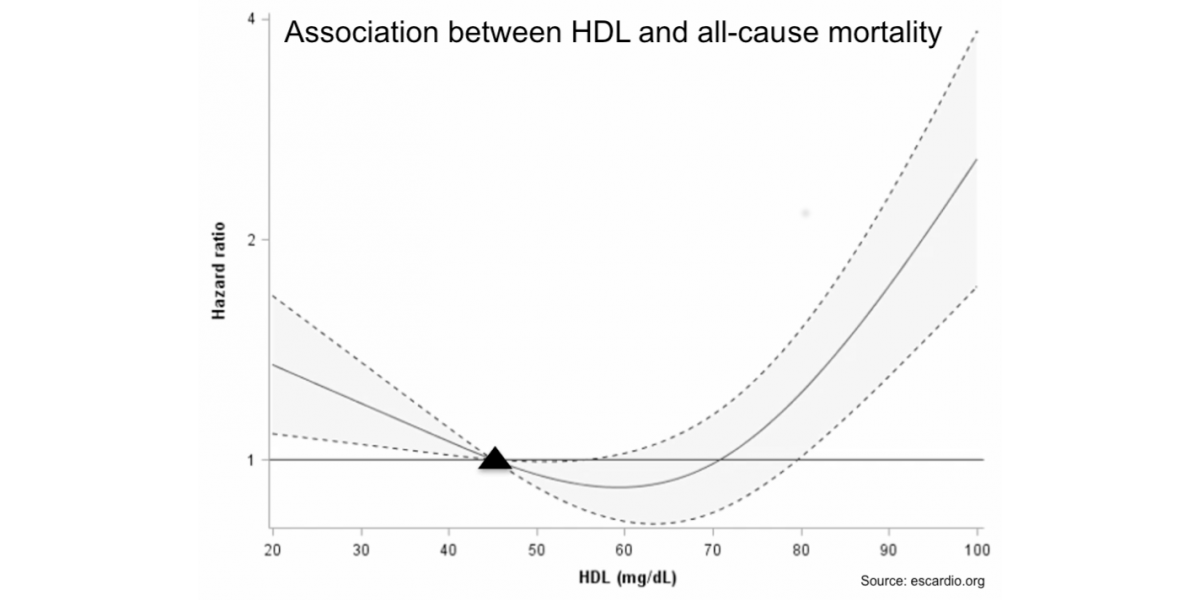
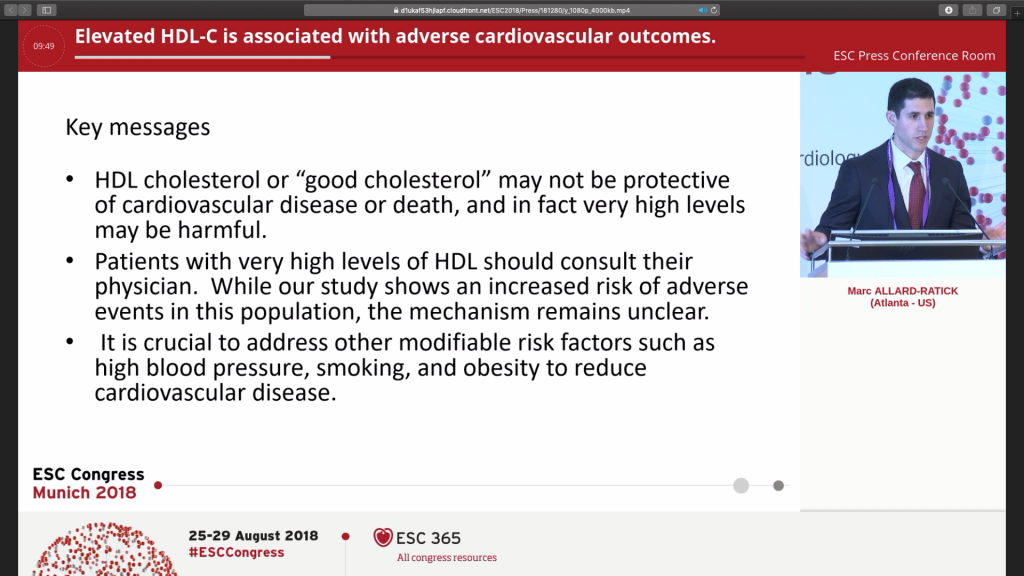
It was based on a study out of Emory University in Atlanta that showed higher all-cause mortality associated with HDL levels above 80!  Below is a screen capture from the press conference where the study results were presented showing “U curve” associated with adverse events with both low HDL (<40 mg/DL) and very high HDL (>80 mg/DL).

HDL-U-Shaped-Curve
Risks of mortality are higher with very low AND very high levels of HDL

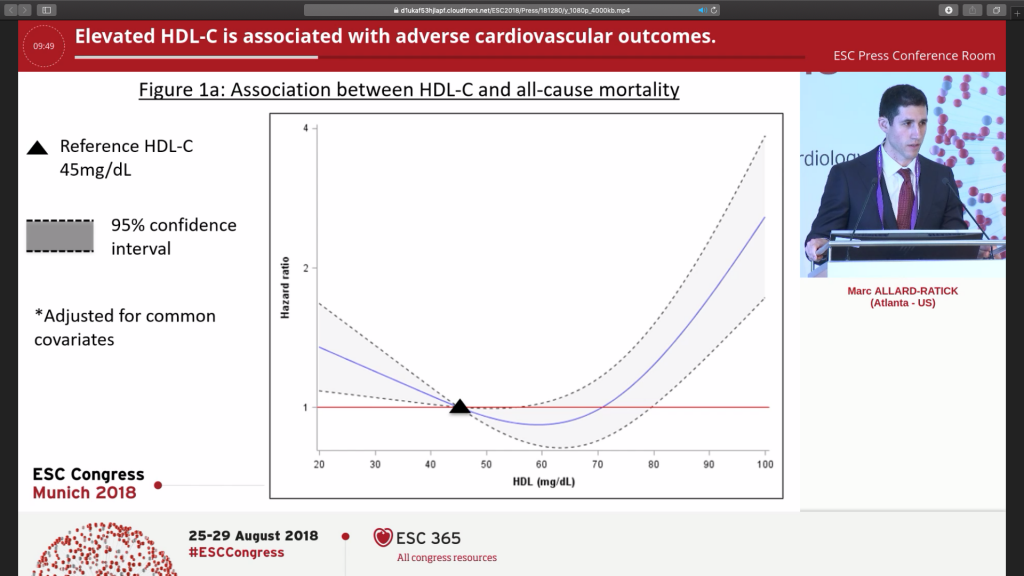
The authors acknowledge some limitations of the study.  The study started with patients that already had severe heart disease and speculate there may be some reverse causation.  They also recognize that genetic mutations may be at play, citing LIPG, SCARB1, and CETP (which mean nothing to me right now!)

The recommendations were very nuanced.

HDL-Nuanced-Recommendations
Because the mechanism of high HDL and higher mortality is not known, the recommendation is to focus on risk factors we can control.

Because the mechanisms remain unclear as to why high HDL levels are associated with adverse events, they recommend focusing on the mechanisms we do know about!  Still, this is the first data point I’ve seen speculating that HDL might not be protective at very high levels.  This will be very interesting data to watch going forward!

The video of the press conference is accessible here.

Filed Under: Diabetes

Calendar After Fasting Retreat

December 25, 2018 By spao 3 Comments

Two Months After Fasting Retreat…

Catching Up

I have not been good at keeping up with blogging.  After returning home from the fasting retreat, life got in the way!  I took my labs on November 19th (approximately 2 months after returning from the fasting clinic) and had intended on blogging right away.  However, moving into our new condo, my current consulting gigs, and the kids coming home from college over the holidays just kept me too busy.  Here on Christmas morning, I am publishing a backlog of 3 posts while the kids are sleeping!

Glucose and HbA1C

The bad news here is that my fasting blood glucose during the test was 157!  This number didn’t surprise me that much because it’s a number that I was measuring with my blood glucose meter.  My blood sugar was running higher at the time of the test, as the instructions I received when making the appointment called for keeping a “stable diet and weight” for two weeks prior to the blood test.  So, for two weeks, I chose to avoid the 36-hour fasts which does help control my blood sugar but also makes my weight fluctuate a lot between feeding and fasting.  I won’t follow the instructions that way the next time!

That said, even with the two weeks of without fasting, the good news from my November labs is that my HbA1C (3 month average of blood glucose levels) went down — even after returning home from the fasting clinic!  When I left, my number was 7.0, and it went down to 6.7 two months later!  It’s still not where it needs to be (below 6.5), but it’s close and improving!

Change in LDL Particle Size?

While at the fasting clinic, I also was a participant in a study about the effect of prolonged fasting on LDL particle size.  (For more information about LDL particle size, see my previous article). Alternate day fasting has already been shown to increase LDL particle size, and the prevailing theory is that prolonged fasting produces a similar effect.  The significant reduction in my Triglyceride / HDL ratio from 4.1 before the clinic, to 2.2 immediately after the clinic, and down to 1.7 two months later does seem to support that hypothesis!

The Numbers

Normal 23-Aug 17-Sep 19-Nov Comments
Glucose in serum 60-100 133 106 157 High for 2 weeks…
HbA1C < 5.7 7.5 7.0 6.7 Better!
Cholesterol Total < 200 296 262 288 See note
HDL Cholesterol > 40 52 62 83 Good!
LDL / HDL Ratio < 3.0 3.8 2.9 2.1 Normal!
LDL Cholesterol < 155 296 181 177 See note
Triglyceride < 150 215 136 138 Normal!
TG / HDL Ratio < 2 4.1 2.2 1.7 Normal!

Note: LDL and Total Cholesterol readings have been shown to be flawed predictors of heart disease.  TG / HDL ratio was computed and added to this chart as an alternative predictor.

Filed Under: Diabetes, Fasting

LDL-Patterns

December 25, 2018 By spao 98 Comments

Is Your LDL Pattern A or Pattern B?

Do you have high LDL or high total cholesterol?  If you read my previous article about cheese, you may recall that these LDL or total cholesterol numbers alone are not reliable predictors of mortality from heart disease.

An NBC News piece went further to cite American science writer Gary Taubes who reported that the LDL and total cholesterol numbers have been such poor predictors of disease risk that early screening tests should have likely just tested for HDL and triglycerides and nothing else.

A 1977 NIH study — an early set of papers from the now legendary Framingham Heart Study — confirmed that high HDL is associated with a reduced risk of heart disease. It also confirmed that LDL and “total cholesterol” tells us little about the risk of having a heart attack, language that heart-disease authorities would downplay years later. Given this finding, as Gary Taubes writes in “Good Calories, Bad Calories,” we would have been better off to start testing for HDL — or even triglycerides — and nothing else.

A more nuanced view associates the risk of atherosclerosis and heart disease with the type of LDL particles.  There are two patterns (also referred to as “phenotypes”) of LDL particles.

  • Pattern A: large, fluffy LDL particles which are largely benign
  • Pattern B: small, dense LDL particles which are more likely to oxidize and lodge themselves to arterial walls

Studies have long shown the impact of LDL particle size on disease risk. A 1988 study in the Journal of the American Medical Association documented the association between Pattern B (small, dense) particles and disease risk:

The LDL subclass pattern characterized by a preponderance of small, dense LDL particles was significantly associated with a threefold increased risk of myocardial infarction, independent of age, sex, and relative weight.

So why not test for LDL particle size?  The tests are more expensive!

However, there is an answer.  While testing for LDL particle size is more expensive today than commonly used cholesterol tests, a triglyceride / HDL ratio of 3.8 or higher can predict pattern B with high confidence.  A 1997 Harvard Medical School study also confirmed the efficacy of triglyceride / HDL ratio to predict the risk of myocardial infarction. 

Given the age of these studies, the use of HDL and triglycerides has become accepted practice in some circles, as described by Everyday Health.

According to Scott W. Shurmur, MD, the medical director of the cardiovascular center at Texas Tech University Health Sciences Center in Lubbock, Texas, the particle test should be used for people who have other risk factors for heart disease or stroke, such as a family history of heart disease at early ages. “At the same time, standard cholesterol tests like HDL and triglycerides provide similar information (and are less expensive), particularly if non-HDL cholesterol is incorporated into the assessment,” says Dr. Shurmur.

Unfortunately, there are no widely adopted standards today for metrics of triglyceride / HDL ratios in common clinical practice.  Some researchers have provided guidelines, including Zone Diet creator Dr. Barry Sears who wrote:

How can you tell which type of LDL you have? All you have to do is determine your ratio of triglycerides to HDL cholesterol, which would be found as part of the results of your last cholesterol screening. If you ratio is less than 2, you have predominantly large, fluffy LDL particles that are not going to do you much harm. If your ratio is greater than 4, you have a lot of small, dense LDL particles that can accelerate the development of atherosclerotic plaques – regardless of your total cholesterol levels.

Still, patients who view their standard lab test results will notice that standard lab results list other ratios including Total Cholesterol / HDL and LDL / HDL ratios, but they do not list Triglyceride / HDL ratios. 

Cholesterol-Tests
High LDL and Total Cholesterol Readings with Normal Ratios
(TG/HDL = 138/83 = 1.7)

So why aren’t Triglyceride / HDL ratios more in use, or why aren’t LDL particle sizes discussed more often in the doctor’s office?  After all, most of the research cited in this blog article is decades old!

Frequent readers of this blog know my skepticism around a lot of Western Medicine.  Most continuing education for doctors is sponsored by pharmaceutical companies who have commercial interests in promoting use of lab numbers that their drugs can lower!  According to an academic paper titled “Statins Do Not Decrease Small, Dense Low-Density Lipoprotein:”

Our study suggests that statin therapy—whether or not recipients have coronary artery disease—does not decrease the proportion of small, dense LDL among total LDL particles, but in fact increases it, while predictably reducing total LDL cholesterol, absolute amounts of small, dense LDL, and absolute amounts of large, buoyant LDL.

In other words, drug companies likely suppress the information about LDL particle sizes because their drugs preferentially target the benign “Pattern A” particles over the more harmful “Pattern B” particles!

My opinion: Before going on cholesterol lowering drugs, take a look at your triglyceride / HDL ratio.  You may have “Pattern A” LDL particles and be at lower risk of heart disease than your LDL or total cholesterol numbers suggest.

Filed Under: Diabetes, Fasting, Featured

Sickness - viral or bacterial?

December 25, 2018 By spao Leave a Comment

Feed a Cold, Starve a Fever? It depends!

The old advice to “feed a cold, starve a fever” is a controversial one.  Given the controversy, I wanted to explore some of the differing opinions — the history, the conventional Western medicine view, and what the latest science suggests.

The Historical View

The old wives’ tale came from the belief that eating caused the body to “heat up” to mitigate the effects of a cold, and that fasting could help the body “cool down.”  On the surface, this hypothesis sounds logical, as eating does start digestion which does increase metabolism and generate heat.  Chemically, the process of digestion breaks chemical bonds, causing the release of heat.

That said, the body is a complex system, and more modern views dig a bit deeper.

Conventional Western Medicine

Western medicine has largely rejected traditional wisdom and dispensed the advice that eating through illness is always better.  A WebMD article jokes about the following:

Starve a Cold, Feed a Fever? If you’re not quite sure how this saying goes, you can relax: Starving is never the correct answer.

This rationale of the article is that many nutrients help fight infection, such as antioxidants, including beta carotene, vitamin C, and vitamin E, bioflavonoids, glutathione, and phytochemicals.

A Scientific American article concurs:

But recent medical science says the old saw is wrong.  It should be “feed a cold, feed a fever.”

The article also notes some additional points:

  • Supplements are “dubious at best.”  Studies show little or no benefit of taking vitamin C, zinc, or echinacea supplements alone in fighting illness.
  • “Even more crucial is drinking.”  The article points to the importance of fluids over food itself. Just make sure to avoid caffeine and alcohol!

The Latest Science: It Depends

A recent study by Yale researchers also shows the right answer may be even more nuanced.  Published in the September 2016 issue of Cell, the paper titled “Opposing Effects of Fasting Metabolism on Tissue Tolerance in Bacterial and Viral Inflammation” suggests that the advice of feeding versus fasting depends on whether the illness is viral or bacterial.

Graphical abstract of "Opposing Effects of Fasting Metabolism on Tissue Tolerance in Bacterial and Viral Inflammation"
Graphical abstract: Ketone bodies limit ROS-induced neuronal damage during bacterial inflammation. Glucose utilization prevents UPR-mediated neuronal damage during viral inflammation. Source: Cell, September 2016.

As suggested by the diagram above, further research showed that different areas of the brain were affected depending on the type of infection, and the body’s metabolic needs differed based on which part of the immune system was activated.

The researchers published a nice explainer video on YouTube.

What does this mean for us practically?  It’s not so simple.  Many diseases are both viral and bacterial.  So, the advice of the researchers is for us to listen to our bodies.  If we feel hungry or don’t feel like eating when sick, it may be our bodies’ way of telling us how to fight the infection appropriately!

Filed Under: Fasting

Primary Sidebar

Recent Posts

  • Sharing the Good & Bad of Ozempic on Medium
  • Why I stopped taking Vitamin B supplements
  • What changes when you progress from chronic kidney disease stage 3B to stage 4?
  • Ozempic treats diabetes (but I didn’t lose weight!)
  • Glucose might not be the cause of Type 2 Diabetes

Archives

  • February 2025
  • December 2024
  • August 2024
  • November 2019
  • October 2019
  • June 2019
  • May 2019
  • December 2018
  • November 2018
  • September 2018
  • August 2018

Categories

  • Buchinger-Wilhelmi
  • Buchinger-Wilhelmi 2019
  • Chronic Kidney Disease
  • Diabetes
  • Fasting
  • Featured

Sign up for updates to Time-Restricted

Footer

Stephen Pao is the author of the Time-Restricted blog. Following a Type II diabetes diagnosis in 2003, Steve began experimenting with alternative approaches to managing the disease, including prolonged fasting as a complement to a low-carb lifestyle. Several years ago, Steve also added a more involved drug program, including Ozempic and Jardiance. By day, Steve is a consultant and board advisor to early stage technology companies. Steve and his wife are empty nesters, with two adult daughters.

Copyright © 2025 Stephen Pao · Log in